Grafana Cloud
Monitoring and observability with Grafana Cloud
Updated date: 2024-11-21
Grafana Cloud
Metrics Monitoring
Installation
-
Prometheus is an open-source systems monitoring and alerting toolkit. I set it up on my local machine with the following steps:
- Download the latest version of Prometheus from the Prometheus repository
- Extract the tarball and navigate to the directory
- Check your grafana cloud account for your user id and token
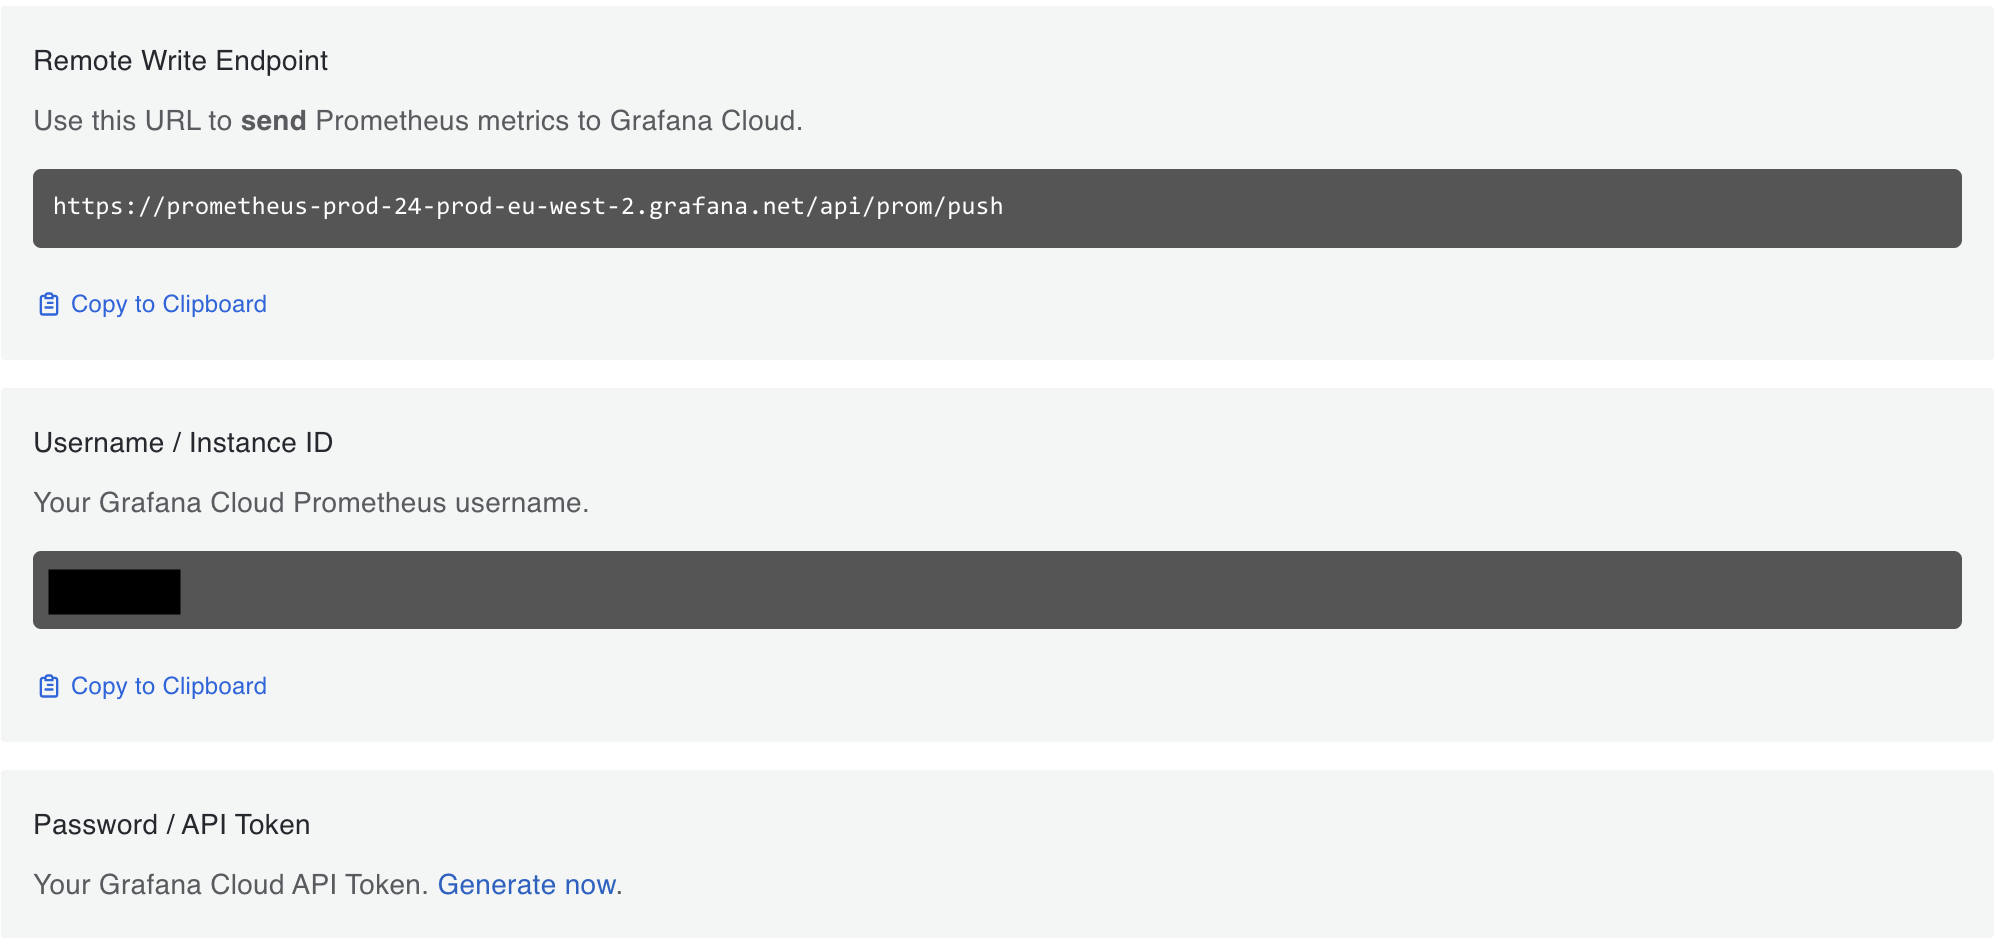
- Add the following content to a
prometheus.ymlconfiguration file:
remote_write: - url: https://prometheus-prod-24-prod-eu-west-2.grafana.net/api/prom/push basic_auth: username: <your user id> password: <your token>- Run the following command to start Prometheus:
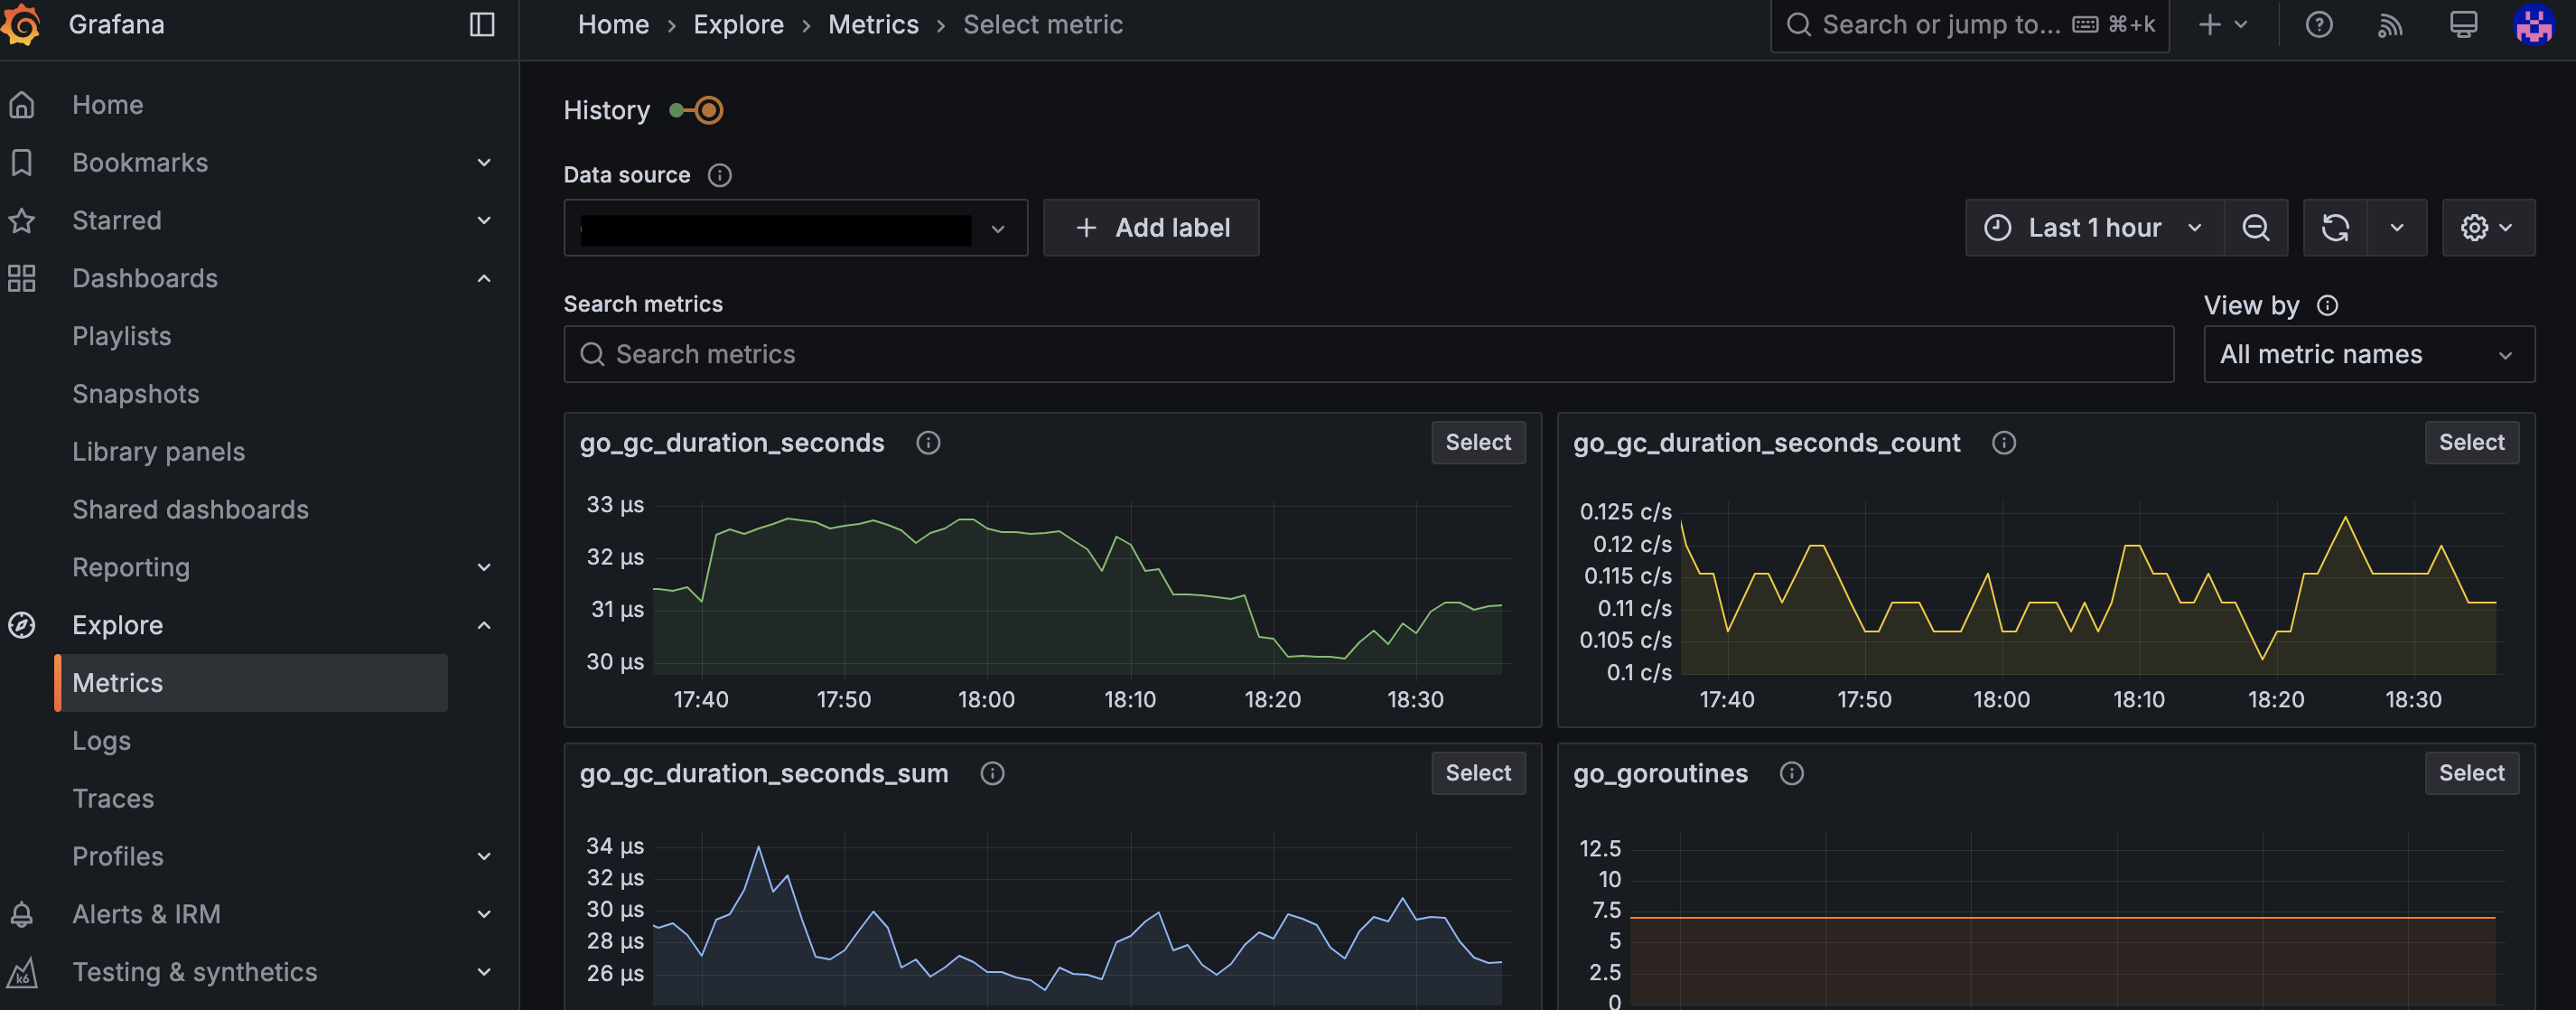
./prometheus --config.file=prometheus.yml
Sample Screenshot
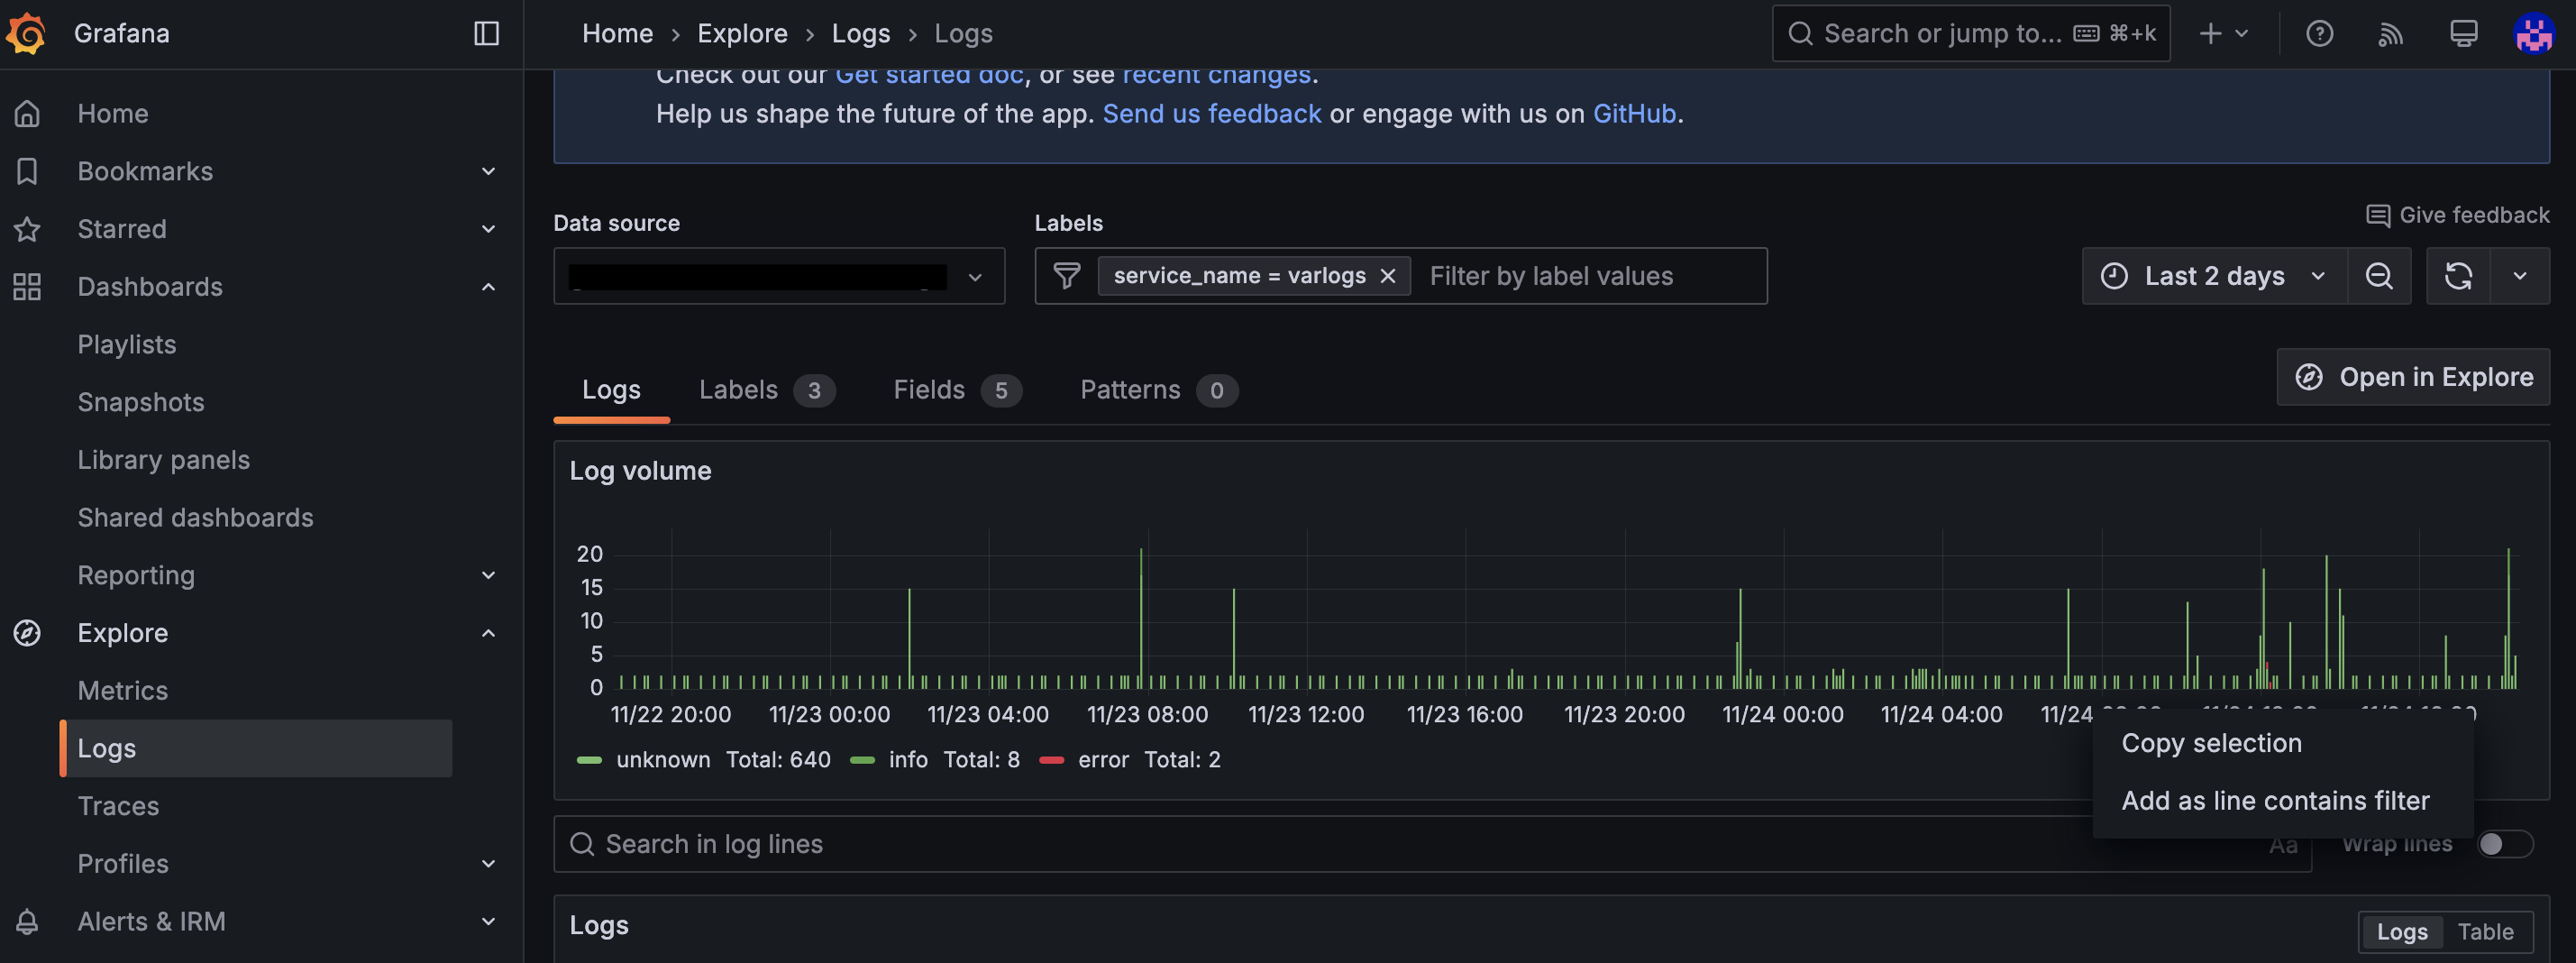
Log Monitoring
Installation
-
Download promtail from the Loki repository
-
Extract the tarball and navigate to the directory. Then update the
promtail-local-config.yamlconfiguration file with the following content:server: http_listen_port: 0 grpc_listen_port: 0 positions: filename: /tmp/positions.yaml clients: - url: <your url> scrape_configs: - job_name: system static_configs: - targets: - localhost labels: job: varlogs __path__: /var/log/*.log -
Run the following command to start promtail:
sudo ./promtail-linux-amd64 -config.file=promtail_config.yaml
Sample Screenshot